Heart-Rate Visualising Clock
Coded piece that uses average heart-rate data per minute to make a personal clock design.
{coding}
(2019)
[final clock timelapse]
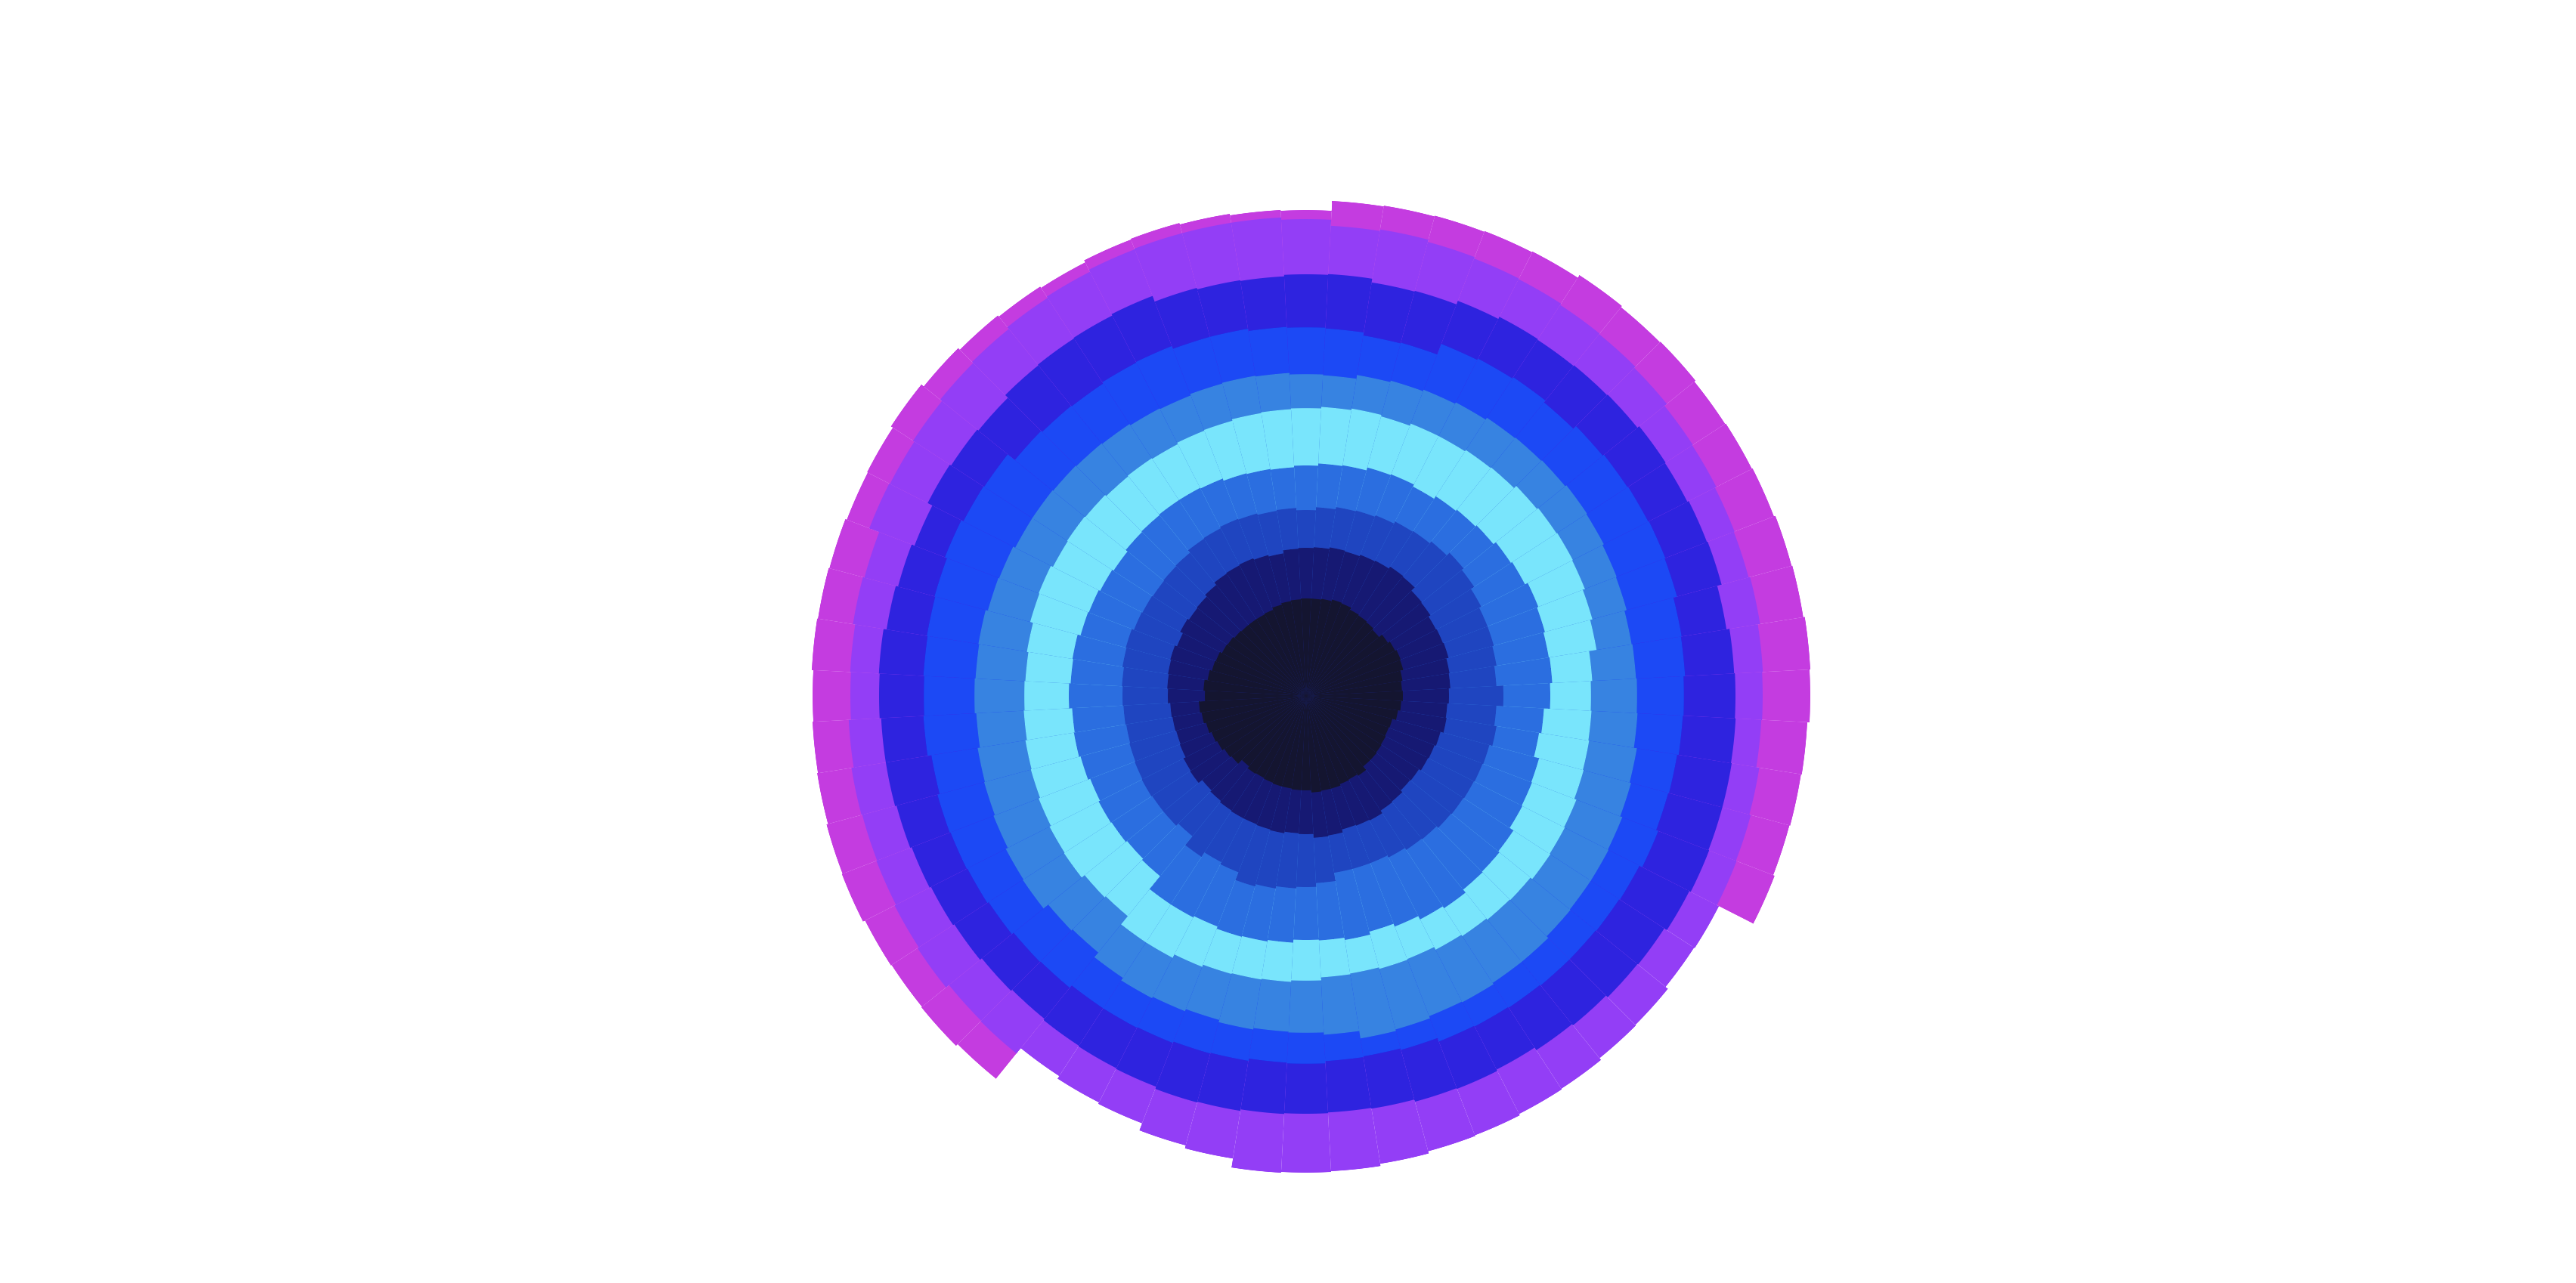
I created a clock visualisation displaying a person's day passage using their heart-rate average data per minute to create magnitudes of the slices. There are 60 slices within each ring. With every hour a new colour ring begins. After 12 hours the clock restarts with a change of fthe colour. Colour shades vary between warm tones and cold tones.

[time: 14hrs 40mins]

[time: 16hrs 35mins]

[time: 18hrs 30mins]

[time: 21hrs 43mins]
data supplied by: Marko Matušovič
